Big Data Is Dead
…or…blind allegiance to numbers and a lack of trust in intellect leads to mistakes.
Data – Both the source of and solution too, all life’s problems…
Data, used well, is an incredibly powerful thing. It informs our decisions, highlights areas we may have missed and even sparks the routes of our own creativity.
Yet, the way it gets used is very different. One of the best quotes on the subject comes from Andrew Lang who states:
“He uses statistics as a drunken man uses lampposts – for support rather than for illumination.”
Instead of using data for what it was intended, to illuminate and inform, we are using it for support. Things have started to go further than this in recent years. Now, any decision you make has to be backed up with at least 1 or 2 spreadsheets, even if the data is irrelevant or has taken an inordinate time to gather. This “comfort” in data effectively passes the blame onto something else if all goes wrong. Effectively, No one gets fired for buying IBM…
Yet, this “comfort” in data is leading to mistakes, some of which are on the highest stage.
Data, Politics and Ada
Robby Mook was the Key Strategist for the Clinton campaign against Trump. For the campaign, they hired 60 mathematicians and statisticians—several from the Obama campaign—to create a software program, Ada, that used statistical modelling to plan their campaign.
With the insights from Ada, they pushed 70% of the campaign budget at TV ads, specifically around what the software thought were potential swing states. The model assumed that blue-collar voters would reliably vote Democrat, most recently for Obama, and they would do so again. With blue-collar votes as her unshakeable base, Clinton would then coast to victory by persuading Minorities and Liberal Elites to vote for her.
With hindsight, we know that this wasn’t a good move, but there were signs early on. The first hint of trouble should have been around the challenge of Bernie Sanders. This was a 74 year old socialist senator from Vermont. He wasn’t even a democrat until he challenged Clinton. Yet he ran her close by emotionally appealing to blue collar voters.
Then, when up against Trump, Bill Clinton pointed out that the campaign should try to emotionally connect with blue collar workers in the Midwest. Places like Wisconsin and Arizona. Whatever you think about Clinton personally, his record proves he is an instinctive political genius. Yet, rather than just disagree with him, Robby Mook actually took to mocking him stating that “my data disagrees with your anecdotes.”
Needless to say, Hilary lost the campaign due to losing those “safe” blue collar states like Wisconsin and Arizona to the emotive and mental statements from Trump…
Data is only as good as its sources and its interpreters
Clinton, Mook and her campaign team had gotten too comfortable in the blanket of their data. To express an opinion or use ones experience and intellect, was to take a chance, one that you could be punished for.
When working with data, we have to consider two key areas, the source of the data (i.e. where its from) and who/what will interpret the data (machine/human). Within the marketing industry, we spend some time optimising our sources, but barely any time looking at how we interpret the data.
Your brain = The best all round interpreter available
We rely heavily on machines and other tools to process and interpret data for us, yet the best interpreter of data currently available resides in the space between your ears. Human brains are primed for Pattern Matching, meaning that we can see patterns far more quickly than most machines or programs. We also have a wider knowledge base to work from, nuance, a working understanding of human beings and the ability to question ourselves.
We need to be making more of this ability, alongside our own experience and expertise. We can only do that by looking at our relationship with data and improving not only how it is gathered, but how it is utilised.
How can we improve?
- Get your data management in order
Data management is fundamental to any piece of analysis we do. The first place that problems can arise is from poor data management principles. Things like misnamed items, missing data or overloaded data bases can impact how we pivot and interpret the data we receive.
In order to improve this there are 4 key areas we need to improve:
Collect
- What are your data sources?
- External and internal assets?
- Structured data, unstructured data, both?
- How will the data be collected?
- Is this a task that will be done manually or automated?
Prepare
- How will you clean and transform raw data to prepare it for analysis?
- How will you identify incomplete or disparate data?
- What will be the guidelines for naming data?
Store
- Where will you store your data?
- Will you use XML, CSV, databases for structured data?
- Do you need a data lake for unstructured data?
- How will you keep your data secure?
Analyse and Distribute
- Which teams or departments need the ability to collaborate?
- How can you make access to data and analysis easier for the end-user?
- How will you communicate any data insights?
- Use Multiple Sources
One YouGov poll is not good enough to build an entire marketing strategy around…
We need to get into the habit of using multiple sources of truth (where possible) rather than just one. As highlighted in the previous section, there are numerous ways data gathering and insight can go wrong. By using multiple sources, we decrease that likelihood, ensuring that the data you do gather is more likely to show relevant insights.
You can further negate the impact of corrupted data by using different types of data. We generally steer towards quantitative data within our industry, yet there is huge value to be gained by supplementing this with qualitative data.
Qualitative data is far more difficult to put in a spreadsheet but can be far more valuable. Actual insights from your customers and your sales team, often trumps a Google Search Term Report…
Ideally, we need multiple types of each
Quant Insight + Qual Insight => Usable Insights
Quant Insight + Qual Insight + Quant Insight + Qual Insight + Quant Insight + Qual Insight => Reliable Insights
- Listen to your gut
Your gut is an important part of your analytical armoury. Granted, you should let it make all your decisions, but its important to listen to it when something feels off. Your brain is making a thousand calculations a second and it may have picked up on something you haven’t seen yet.
“Use your gut, but think of it as another data point”
Gary Klein
If something feels off or “doesn’t look right”, use that as a data point to further your investigation. Allow that to give you another angle to look at things in more detail. Try to understand why something looks off and make amends for it. It may well just be a bias (which you can likely ignore) but it may be down to something much deeper.
- Know when to use your Intuition
Intuition is a maligned skill that we all have. Its based on our years of learning and experience, getting better over time due to the experiences we have had and the things we have seen.
Yet, intuition and experience often gets trumped by data. Intuitive thinking now has to back itself up with “data” before anyone takes it seriously. This is a problem is it means time is spent proving something you already know, which could make the difference between an opportunity being taken or lost.
However, your intuition isn’t infallible. With this in mind, it’s important to use it at the right time. Daniel Kahneman actually talks a lot about this. He believed that we should use our intuition in situations that:
- We have some regularity with
- We have had a lot of practice with
- We get immediate feedback (or at least feedback we can directly attribute to the action)
In a situation when those areas are met, intuition will often outperform a spreadsheet.
- Implement Pre-mortems
Pre-mortems sound significantly more morbid than they are. The idea of them is that you look for what could potentially go wrong before a major project and put things in place to negate them.
In a pre-mortem, team members assume that the project they are planning has just failed—as so many do—and then generate plausible reasons for its demise.
Those with reservations may speak freely at the outset, so that the project can be improved rather than autopsied.
This allows you to spot potential problems, not only in the implementation of a project, but also in its inception and its analysis. This means you can highlight areas where your data sources and your data interpreters are week, before they become an issue.
- Data cannot remove risk if you want to be creative
Data is now often being advertised as something that can “take the risk out of your advertising”. The idea is that if you have enough data points, you can predict everything from a campaigns performance through to where it should be placed and who it should target.
Whilst data can be helpful and is necessary in modern advertising, there is no way it can completely negate risk from a good marketing campaign. It can tell you how to do mediocre campaigns, it can tell you how to match and replicate the competition. But then it turns into either a race to the bottom on price or to the top on Adspend.
Marketing has to be Remarkable
In advertising, data can only get you so far. You need something more to go with that.
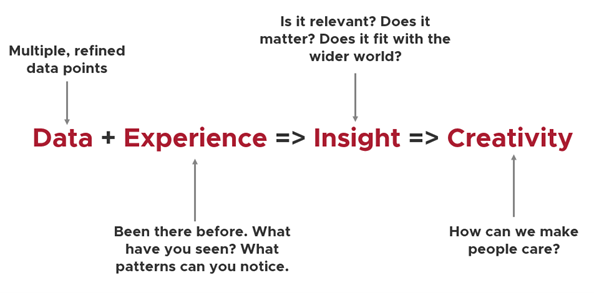
Creativity is born of insight and insight comes from data and experience. If any part of this chain is broken, your campaign will not fire as well as it should do.
Conclusions
Data is a vital part of the marketing mix and has been used extensively for well over a century now. But as an industry, we are far too closely wedded to it. We need to take a step back and embrace the other opportunities in front of us.
We need to look at the opportunities that experience gives us, whilst also expanding the types of data we use (qualitative, “your gut”). All whilst ensuring that our primary data points remain reliable, structured and easily accessible.
On top of all this though, we need to ensure that creativity remains central to our campaigns and our approaches.
View All Blog Posts →